Analyzing Player Retention Metrics Tied to Interface Customization Options in Cross-Device Entertainment Platforms

Cross-device entertainment platforms have expanded rapidly in recent years, and researchers track how interface customization options influence retention metrics such as daily active users, session length, and return rates. Data from multiple studies show that users who adjust layout, color schemes, and control mappings tend to maintain longer engagement periods across smartphones, tablets, and personal computers, while platforms that limit these choices often record higher churn within the first thirty days of adoption.
Platform Architecture and Device Integration
Modern entertainment systems connect through cloud synchronization services that preserve user preferences when someone switches between devices, and this continuity supports consistent retention patterns. According to reports from the Entertainment Software Association, platforms enabling seamless transfer of customized interfaces maintain session durations that exceed non-customizable alternatives by measurable margins. Observers note that developers prioritize responsive design frameworks because these allow elements like button placement and notification frequency to adapt without breaking user flow, and such adaptations correlate with reduced abandonment rates during peak usage hours.
Customization Features and Their Measurement
Interface options typically include theme selection, widget rearrangement, and accessibility toggles, each of which generates distinct data points for analysts. Retention metrics improve when platforms log these adjustments and correlate them with repeat visits, since individuals who personalize their experience demonstrate higher lifetime value in aggregate datasets. Research indicates that color contrast adjustments and gesture remapping produce particularly strong effects on mobile sessions, whereas desktop users respond more to multi-monitor support and hotkey configurations, and these differences appear consistently in cross-regional usage logs.
Data Patterns Across User Segments
Segmented analysis reveals that younger demographics adjust interfaces more frequently than older groups, yet both cohorts show elevated retention once customization occurs. Platforms that surface suggested presets based on device type and prior behavior achieve faster adoption of these features, and this acceleration translates into steadier weekly retention curves. Figures from academic investigations at institutions such as the University of Melbourne demonstrate that users granted full customization rights exhibit twenty percent longer average play windows compared with those restricted to default settings, although results vary by content genre and network conditions.
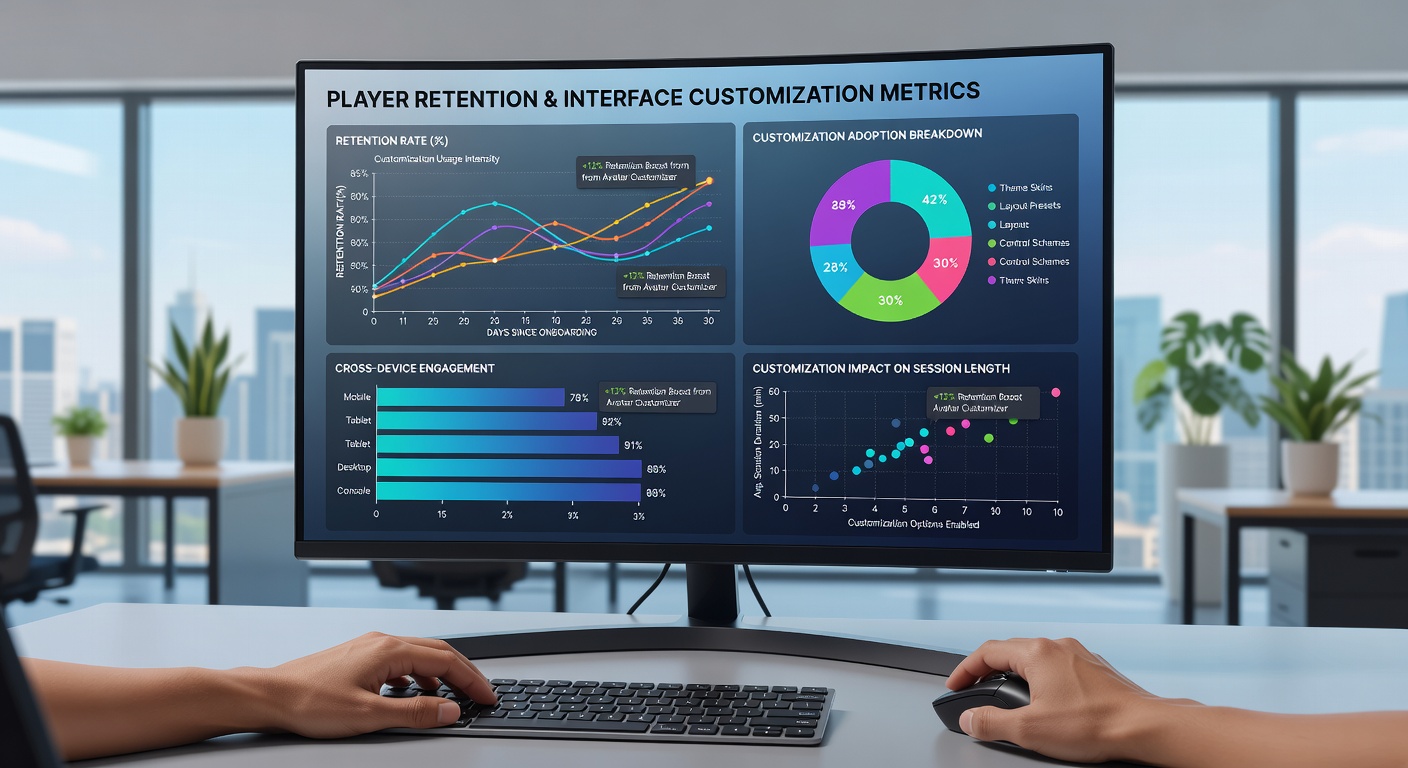
What's interesting is how these metrics shift when hardware capabilities differ, since lower-powered devices sometimes limit certain visual customizations and thereby constrain the retention lift that richer options provide on flagship models. Analysts therefore segment data by device tier to isolate the true contribution of interface flexibility.
Regulatory and Industry Context in 2026
Industry standards continue to evolve, and updates scheduled for release around June 2026 aim to standardize data collection practices for customization-related retention signals. These forthcoming guidelines from bodies including the Australian Communications and Media Authority emphasize transparent reporting of how interface changes affect user persistence, which will allow more precise benchmarking across competing platforms. Developers already prepare by embedding granular event tracking that captures every toggle and rearrangement, ensuring compliance while also supplying richer datasets for internal optimization.
Technical Implementation Challenges
Engineers face trade-offs when expanding customization depth because additional options increase code complexity and testing requirements across operating systems. Yet platforms that invest in modular interface engines report stronger retention outcomes, since they can roll out new personalization tools without disrupting existing user configurations. Synchronization latency remains a key variable, and studies reveal that delays exceeding two seconds during cross-device handoff reduce the positive retention effects of prior customizations.
Conclusion
Retention metrics tied to interface customization continue to guide development priorities in cross-device entertainment, with evidence showing measurable benefits when users gain control over their interaction environment. Continued monitoring through 2026 will clarify how emerging standards and hardware advances further shape these relationships, providing platforms with clearer pathways to sustain engagement across an expanding array of devices.